

Solana’s surging performance, bullish signals, and positive outlook for 2026.
This guide provides a Solana crypto price prediction using technical indicators such as RSI, MACD, and moving averages. Explore SOL price forecasts for today, this week, and the long term through 2040, along with key support and resistance levels, momentum analysis, and market outlook. Whether you are tracking short-term price action or evaluating future potential, this forecast offers a data-driven view of Solana’s expected performance.
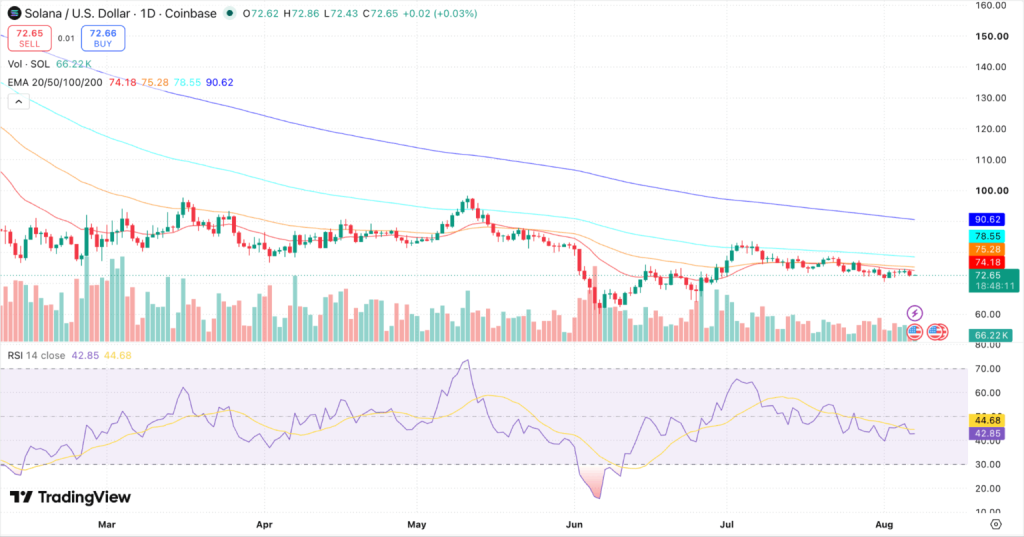
Solana (SOL) is currently trading near $72.65, coiling directly above its $72.27 swing low after this week’s bounce attempt faded as per the latest TradingView chart. The 14-day RSI stands at about 42.9 and has slipped back beneath its moving average at 44.68, reversing the crossover it posted two sessions ago, while the 20-day, 50-day, 100-day, and 200-day EMAs are positioned at $74.18, $75.28, $78.55, and $90.62, respectively. SOL remains below all four EMAs, and today’s low of $72.43 came within 16 cents of the swing low.
Key Insights
- Short-term outlook: SOL is trading below its 20-day EMA ($74.18), 50-day EMA ($75.28), and 100-day EMA ($78.55), and the higher low built earlier this week has already been given up. The $72.27 swing low is the decisive level, with $74.18 the first resistance to reclaim on any recovery.
- Medium to long-term outlook: For the SOL price prediction 2026, Solana is compressing beneath the 20-day and 50-day EMA band at $74.18-$75.28. The 100-day EMA at $78.55 is the level that would confirm a recovery, while the 200-day EMA at $90.62 remains the major long-term resistance.
- Technical analysis: RSI at about 42.9 has crossed back below its moving average of 44.68 and remains under the 50 midline. The MACD line has fallen from -0.74 to -0.83 with the signal at -0.68, so the bullish crossover that looked close earlier in the week did not arrive. Today’s 43-cent trading range points to compression, and $72.27 is the level that resolves it.
Solana Short-Term Price Prediction – Today, This Week, August 2026
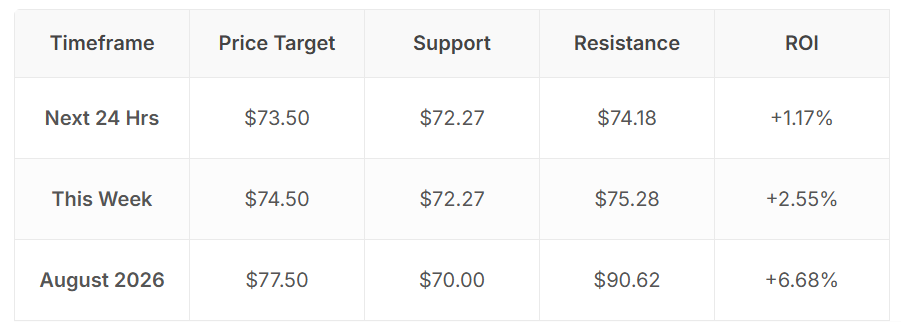
Here is the SOL price prediction 2026 for today, this week, and August 2026.
Solana Price Prediction Today
Solana is trading near $72.65 after a flat 0.03% session and is holding just above its swing low. Immediate support sits at today’s low of $72.43, with $72.27 directly beneath it, while the session high of $72.86 and the 20-day EMA at $74.18 are the first resistance levels to clear.
Solana Coin Price Prediction for This Week
Solana is projected to trade between $72.27 and $78.79 this week. SOL remains below the 20-day, 50-day, and 100-day EMAs, making the $74.52-$75.50 band the key reclaim zone for the week. A daily close above $75.50 could improve Solana’s short-term price outlook and open the path toward the 100-day EMA at $78.79. On the downside, losing $73.32 would put the $72.27 swing low back in focus, and a break there opens the $70 handle.
Solana Price Prediction for August 2026
Solana’s August 2026 price prediction targets $78.50, with a range of $72.27-$90.99. SOL is still trading below its 20-day EMA at $74.52, and the 50-day EMA at $75.50 is the next hurdle above it. A monthly close above $78.79 would strengthen recovery momentum and increase the chances of SOL testing the 200-day EMA near $90.99. However, Solana must keep holding above $72.27 to keep the August 2026 outlook constructive.
Solana Coin Price Prediction for September 2026
Solana’s September 2026 price prediction targets $77.00, with a range of $72.00-$79.00. If SOL reclaims the 20-day EMA at $74.62 and breaks above $75.62, buyers may attempt to push the price toward $78.99. A sustained move above $79 could improve the Solana coin price prediction for Q4 2026 and bring the 200-day EMA at $91.33 into focus. However, if SOL loses $72.27, the price may retest the stronger $70 and $65-$66 support zones.
Solana Price Prediction 2026 (Medium Term)
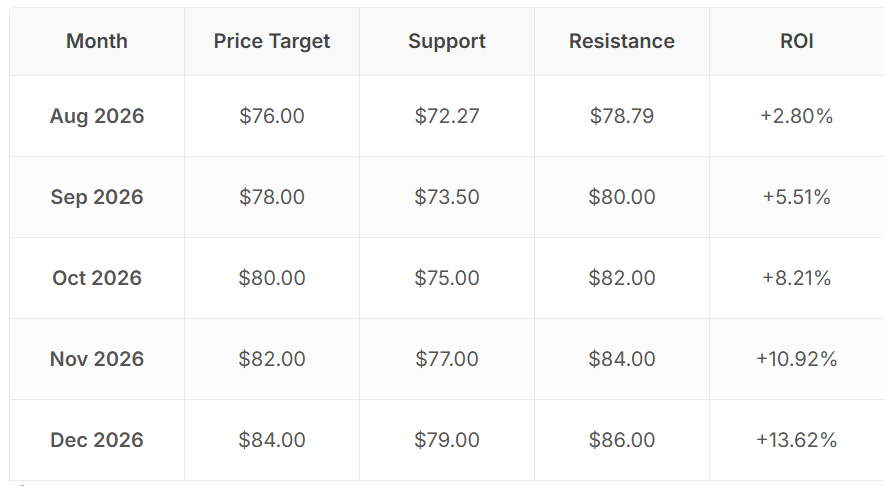
Solana’s 2026 price range is projected at $72-$86 based on the latest EMA structure. The 20-day EMA at $74.52 and the 50-day EMA at $75.50 now sit directly overhead and cap the first recovery attempt, while the 100-day EMA at $78.79 is the level that would confirm a genuine trend change. For SOL to establish a bullish reversal, it must reclaim $75.50 and then break $78.79. Until then, the Solana price prediction stays cautious, with the higher low at $73.32 and the narrowing MACD histogram the two signals worth tracking.
Solana Price Prediction in INR (2026-2030)
For Indian traders, here is what the SOL price targets translate to in rupees.
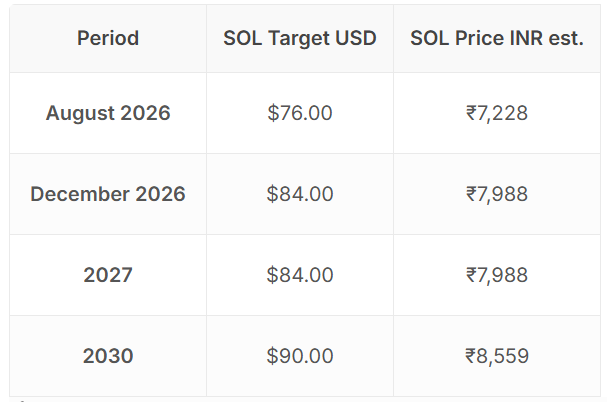
INR estimates based on a USD/INR rate of ~₹95.1. Rate fluctuations will affect actual INR values; verify at time of trade.
Solana Long-Term Price Outlook (2027-2040)
The long-term outlook for SOL rests on three structural drivers: Solana’s throughput and fee advantage as a high-performance settlement layer, the 2028 Bitcoin halving cycle and its indirect effect on the broader digital asset market, and institutional adoption through regulated spot products.
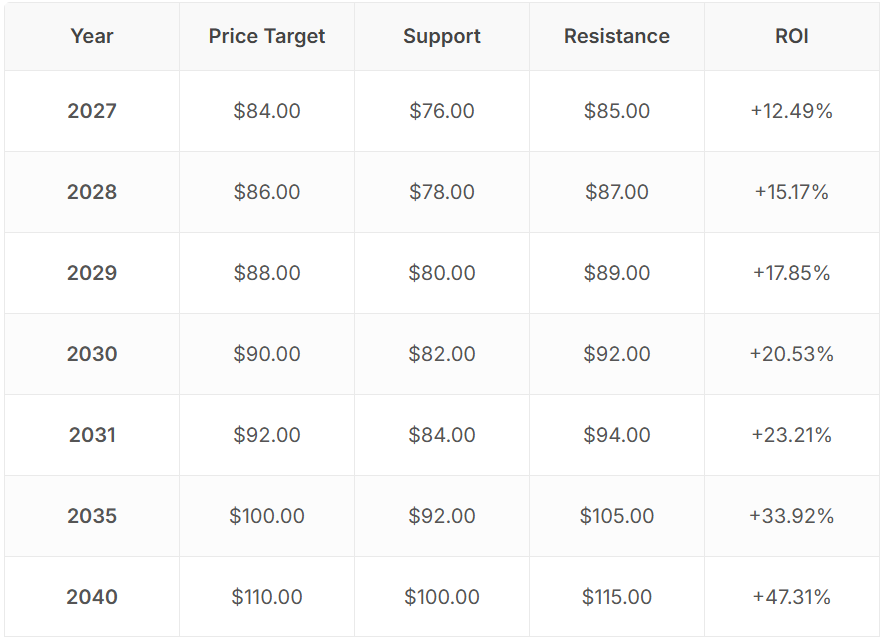
The following forecasts are derived from Power Law and network-adoption models, broader Bitcoin halving-cycle analysis, and historical SOL volatility patterns. They represent scenario ranges, not price targets.
Solana 2030 Forecast: What Is the Expected Price?
Solana price prediction 2030 targets $90.00, within a range of $82.00-$92.00, fueled by a gradual rebuild in trend structure. With price currently below the 200-day moving average and the MACD having crossed below its signal line, the technical picture would first need to improve before sustained upside becomes credible. Stock-to-Flow and Power Law models support a range of $82.00-$92.00 under continued network growth.
Solana 2031 Outlook and Expected Price Range
The Solana price outlook for 2031 targets $92.00, with a range of $84.00-$94.00, as the market works to re-establish a long-term bullish structure. Cycle analysis suggests 2026 could serve as the reference pattern, either consolidating after a period of weakness or establishing a higher base. Long-term support and resistance levels remain the key technical signals to monitor.
Solana Price Prediction 2040: Long-Term Forecast
The Solana price forecast for 2040 projects $110.00, ranging from $100.00 to $115.00. The long-term trend would remain constructive provided price can reclaim and then hold above the major moving averages. Power Law-based scenarios point to $100.00-$115.00 under moderate adoption, while aggressive bullish scenarios could exceed $115.00. These forecasts carry high uncertainty and should be interpreted as scenario ranges rather than fixed targets.
Solana Technical Analysis
The following technical indicators were used to derive the Solana price prediction above. Each indicator’s value should be updated at the time of publishing.

Relative Strength Index (RSI)
The 14-day RSI is at about 42.9 and has dropped back below its moving average at 44.68, undoing the crossover it posted two sessions ago. SOL is not yet oversold, but the failure to hold that signal shows the bounce off the swing low lacked buying support. A move back above 50 would be the first credible sign the Solana price prediction is turning constructive, while a drop below 40 would point to accelerating selling pressure and a test of the levels beneath $72.27.
Moving Averages – 20-Day, 50-Day, 100-Day and 200-Day EMA
SOL is trading below its 20-day EMA at $74.18, 50-day EMA at $75.28, 100-day EMA at $78.55, and 200-day EMA at $90.62. All four continue to slope lower, and the 20-day remains beneath the 50-day, so the near-term structure stays bearish. The 20-day EMA has capped every attempt since late July, which makes $74.18 the level that has to give way before any recovery can be taken seriously. A daily close above $75.28 would be the first real signal, while a break above the 100-day EMA at $78.55 would strengthen the Solana coin price prediction for the coming months.
MACD (Moving Average Convergence Divergence)
The daily MACD is negative, with the MACD line at -0.83 below its signal line at -0.68 and a histogram of -0.15. The convergence that looked promising midweek has not resolved into a bullish crossover; instead both lines have resumed falling together, with the MACD line sliding from -0.74. The histogram is broadly flat rather than widening, so selling is steady rather than accelerating, but there is no positive signal here yet. A crossover would support a test of $74.18, while a widening negative histogram would point toward a break of $72.27.
Volume Analysis
The daily candle is still open at the time of writing, so the figure shown on the chart covers only part of the session and should not be read as a full-day comparison. Recent completed sessions have run in the 500K to 675K SOL range, with turnover thinning through the August drift. Today’s 43-cent trading range on light participation is characteristic of compression ahead of a directional move. Rising volume on a break of $72.27 would confirm seller conviction, while a volume-backed reclaim of $74.18 would signal the opposite. Verify the exact 24-hour figure from a live market data source before publishing.
Disclaimer: This article is for informational purposes only and does not constitute financial or investment advice. Crypto markets are highly volatile. Always do your own research (DYOR) before making any investment decisions.


